Ethereum Price Update
As of today, Ethereum (ETH) is valued at approximately 3,573.91 USD whereas cryptocurrency has experienced a significant decline of 9.15% over the past week. These values pose volatility in market condition.
Ethereum ETH is the second largest cryptocurrency after Bitcoin in the world today with a market cap of almost 20% the entire crypto market in the world today. However, Ethereum has had quite a ride for the past few years and is looking good for the bull market of 2024 pre-halving and post-halving. Ethereum’s price can be very unpredictable and correctly predicting the price within a specified range can be extremely difficult. The currency is currently hovering near $3,800 as it touched the $4,000 mark twice in this week alone. With strong momentum in 2024, let’s see how far Ethereum (ETH) can go in 2025.
Ethereum ETH Current Market Conditions
| Category | Details |
| Cryptocurrency | Ethereum |
| Ticker Symbol | ETH |
| Rank | 2 |
| Price | $3,948.54 |
| Price Change 24H | -0.98% |
| Market Cap | $482,583,271,493 |
| Circulating Supply | 120,089,623 ETH |
| Trading Volume 24H | $24.3 billion (6.3 million ETH) |
| All Time High | $4,891.70 |
| All Time Low | $0.4209 |
Ethereum ETH Historical Price Movement
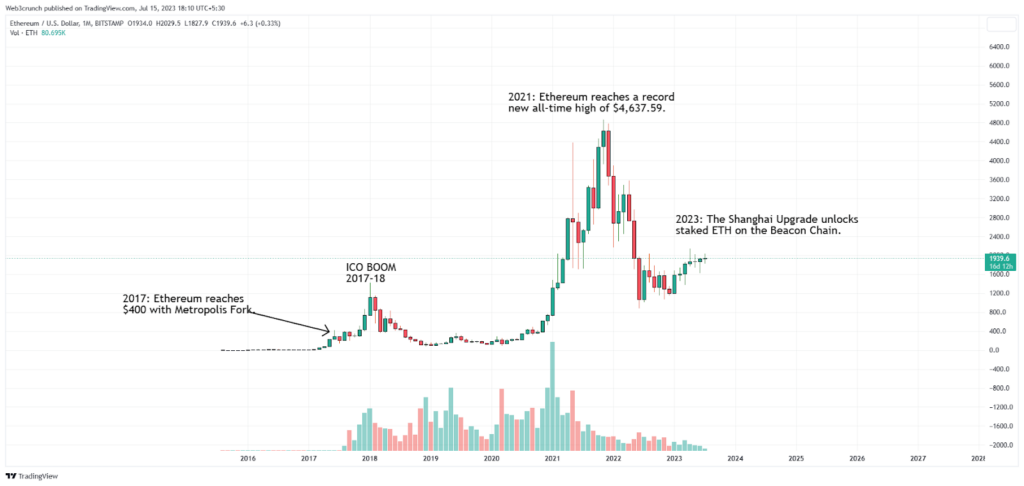
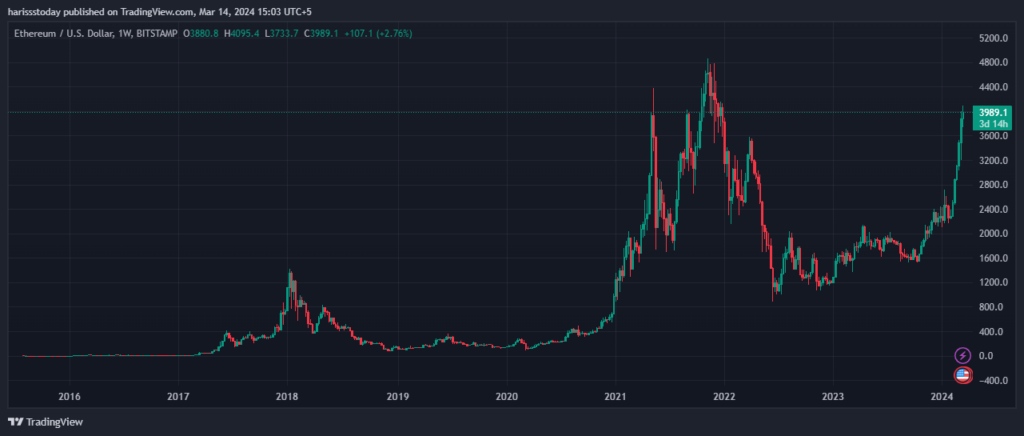
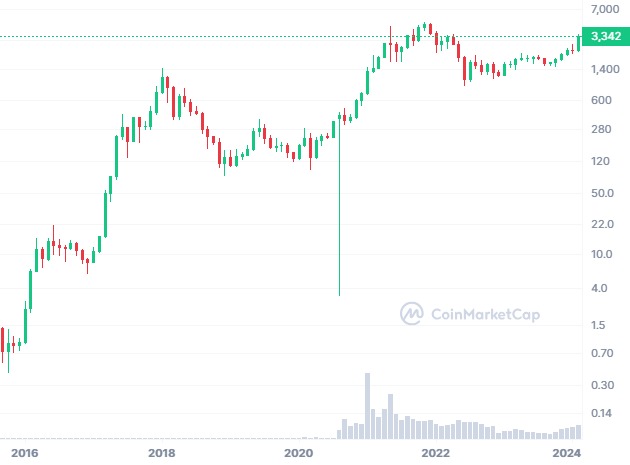
Ethereum has had quite a journey from first being traded below a dollar to reaching the highs of almost $5,000 back in November 2021. Ethereum was launched on July 30, 2015 and it traded for less than a dollar for most of 2015. However, as 2018 came, the price of Ethereum exploded to more than $1,000 and reached $1,270 but was soon followed by a bear market.
Ethereum ETH struggled by that time but soon made a new all time high of $4,891.70 in November of 2021. However, after ETH made this all time high, the bear market started and Ethereum went as low as $892 on June 18, 2022.

Afterwards, Ethereum price kept a positive trend and grew but again was faced by extreme volatility back in 2023 due to a lawsuit between the SEC with Binance and Coinbase alongside Grayscale. During this lawsuit Ethereum’s high went to $2,000 but also dropped as low as $1,000 due to the uncertainty in the market.
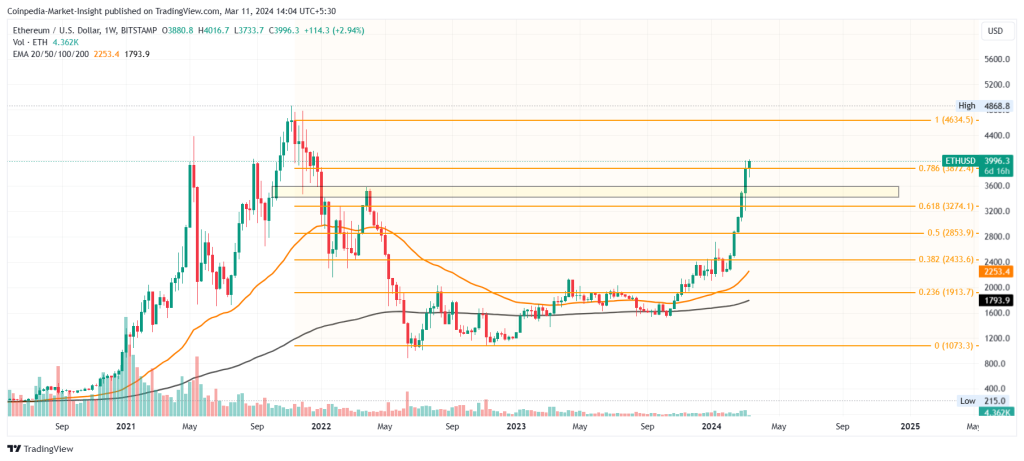
Furthermore, during October 2023, the entire crypto world received a boost in hopes that a Bitcoin ETF approval could be possible very soon. Ethereum ETH finished 2023 with $2,882. In 2024, ETH had already hit the $4,000 mark more than once and continued to push that important resistance to reach the ATH.

However, Bitcoin after its new all time high of $73K has made a healthy correction and dipped to $68 due to which ETH has collapsed below the $4,000 mark. There are multiple reasons for this such as the price action moving in that range would most definitely be influenced by an upcoming Ethereum ETF approval in the near future.
Furthermore, the 2024 Bull market will make everything explode as Ethereum is all said to gain 120% from the current conditions and predictions and could easily touch the $9,000 to $10,000 mark by 2025.
Ethereum ETH Price Prediction for 2025
Ethereum ETH has a lot of pros and cons but still holds a massive share of the market in the crypto world. The smart contracts reduce the use of third parties thus eliminating them and decentralizing the blockchain with continuous improvements that could further boost Ethereum’s transaction speeds as well.
Experts suggest that Ethereum would make a new all time high in 2024 after Bitcoin halving and could go as high as $6,000 by the end of 2024. However, projects also suggest that Ethereum may surge even higher than this and the average cost in 2025 might be $5,800 with going as high as $8,000 and as low as $4,000.

Other promising insights suggest that in 2025, Ethereum might make a new ATH of $10,600 because as a currency matures and gets old, more liquidity is required to boost its price which is why coins and tokens of low market cap are more volatile.
By this projection the average price of Ethereum by 2025 could be $7,400 with highs above $10,000 and lows near $5,300 by the end of 2025.
Ethereum ETH Price Prediction for Future
Cryptocurrencies are very volatile and predicting them can be more than difficult. With so many predictions out there with some skyrocketing the prices while others dumping the entire blockchain, it’s challenging to understand what to believe in.
Technical Analysis of Higher Time Frames with Moving Averages and several other indicators like Relative Strength Index (RSI) and Fibonacci can give us an idea (just an idea) of what the price action might look like in a few months or possibly years.

This is because no matter how thoughtful the prediction, the price can eventually skyrocket or dump by a single news bulletin or movement by a whale. Furthermore, improvements in a blockchain’s ecosystem and flaws that may come in the future cannot be taken into account at the time of prediction and their impact is then neglected.
Therefore, the predictions are only of the historical data and can tell you where the price action SHOULD move regardless of WHEN it moves there.


