SOL is currently one of the most traded tokens on cryptocurrency exchanges. The token has amassed a fair share of the crypto market. Solana blockchain has not only improved over the years but has also seen a growth of almost 8000% in the last few years alone. With huge potential and an amazing community, how far can SOL go? As of March 2024, the SOL token is being traded around $150 on numerous exchanges such as Binance. Experts suggest that SOL can go to amazing heights by the end of 2024 and in 2025. Let’s have a look.
Solana SOL Current Market Conditions
| Attribute | Value |
| Cryptocurrency | Solana |
| Token | SOL |
| Price | $152.10 |
| Market Cap | $67,463,094,402.00 |
| Trading Volume | $5,540,408,691.73 |
| Circulating Supply | 443,537,477.04 |
| All-time High | $260.06 (Nov 07, 2021) |
| All-time Low | $0.5052 (May 12, 2020) |
| 24 High | $155.00 |
| 24 Low | $145.58 |
Solana SOL Historical Price Movement
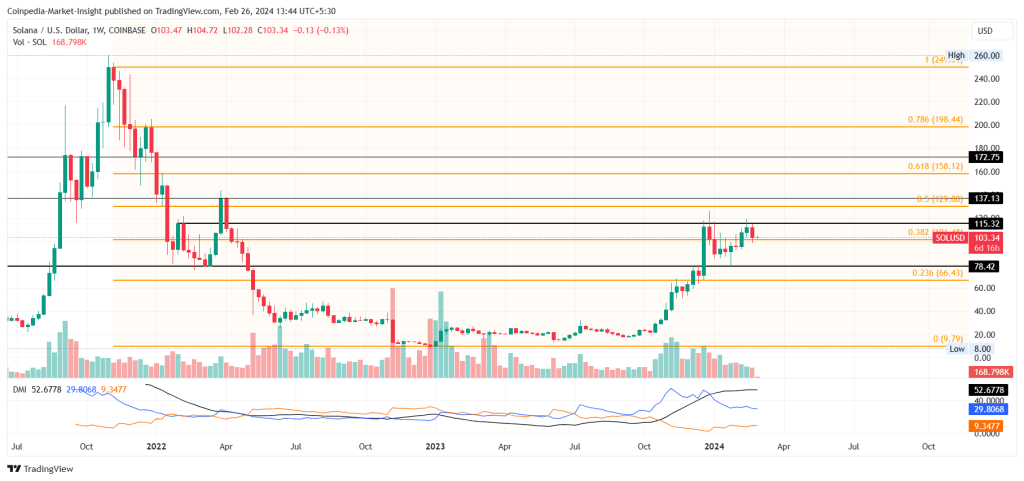
Solana started off in 2020 and was priced $0.2 only and after a while went to it’s All Time Low of $0.5052 in May 2020. However, the token displayed quite the resilience and started growing where it reached its all time high of $260.06 on November 07, 2021.
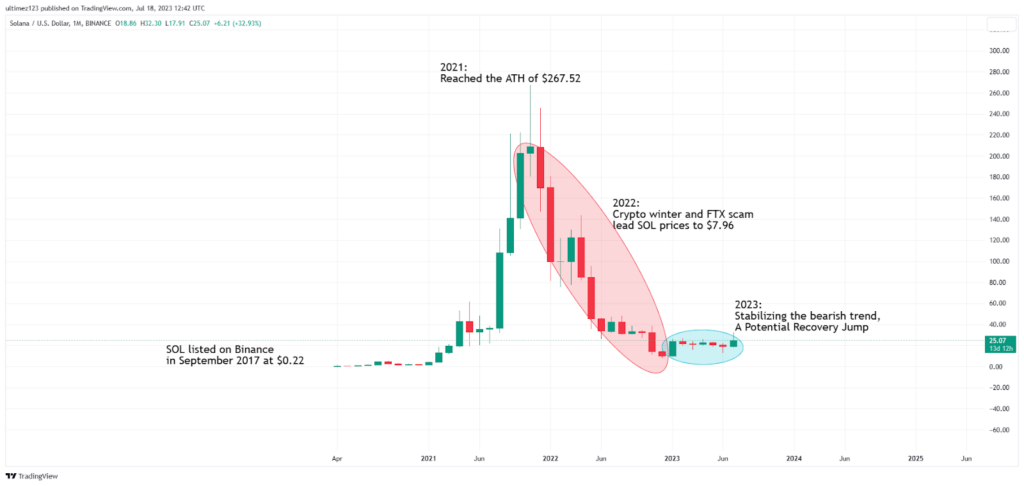
Afterwards, Solana kept diving down in the bear market and stabilized back in 2023 at an average of $30 per token. The token has then taken a bullish approach again from September of 2024 and has consistently been growing due to numerous events.
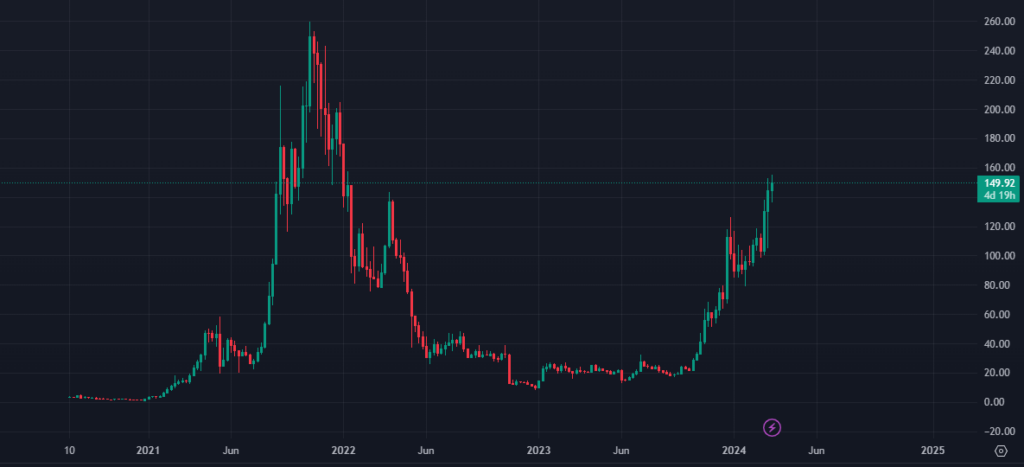
As of now, Solana is showing no signs of stopping the bullish rally and may even end up making a new All Time High by the end of 2024. SOL went down a few months back when BTC dipped to $39,000 to $80 and was stuck below $100 for quite some time after which it finally broke through the resistance at $100 and continued to soar after its successful market testing at $100.
Solana SOL Potential for 2025
According to several renowned experts, Solana has huge potential as a blockchain itself. With its rapid growth, now Solana is being compared with Ethereum and for good reasons as the Solana Blockchain has a somewhat edge over Ethereum ETH.
One of the best things about the Solana Blockchain is that it has the capability of Smart Contracts through which they can easily be used for running applications like DeFI and NFTs.
Another amazing feature of Solana Blockchain is that it also uses Proof of Stake (PoS) in which the validators actually stake their own currency for collateral. Not just that, Solana’s blockchain also implements Proof of History (PoH) which further improves PoH.
However, the most astonishing thing about this blockchain is its transaction speed. This is the edge it has over Ethereum as Ethereum’s transaction speed is slow while Solana Blockchain has immense speed. Solana’s transaction fees are also lower than ETH with high transaction speeds.
It can process 2,700 transactions per second with a transaction fee of $0.00025 while ETH can only handle 15 TPS with a fee of $2.62 as of 2024.
Solana SOL Price Prediction 2024-2025
Solana has one drawback which can either pullback its price or can drag it to another ATH. Solana’s token supply is infinite unlike BTC and numerous other currencies which cannot create a supply shock throughout the market. Supply shocks usually change the market sentiment.
However, with the projections as of yet, there can be two scenarios, either SOL will move to greater heights and show exponential growth in 2025 or can show gradual growth.

The Halving is nearing and the market is currently waiting for BTC’s correction and sideways movement so Altcoins can rally again but this year’s bull market is different as BTC broke the ATH before the halving which has never happened before in history.
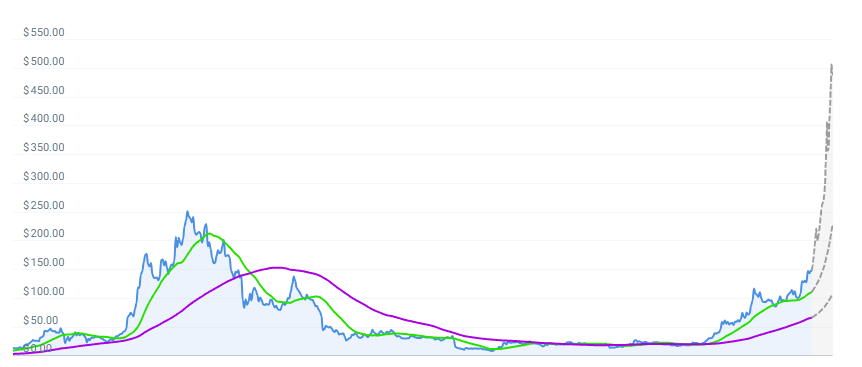
Solana SOL can range between $174 and $213 by the end of 2024 while other projections show that Solana can reach a new ATH of $713 by the end of 2025 with the average price of $250 per token in 2025. If SOL can reach the upper price target by 2024, we can see it increase by almost 300% in 2025.
Solana SOL Price Prediction for Future
Cryptocurrencies are very volatile and predicting them can be more than difficult. With so many predictions out there with some skyrocketing the prices while others dumping the entire blockchain, it’s challenging to understand what to believe in.

Technical Analysis of Higher Time Frames with Moving Averages and several other indicators like Relative Strength Index (RSI) and Fibonacci can give us an idea (just an idea) of what the price action might look like in a few months or possibly years.
This is because no matter how thoughtful the prediction, the price can eventually skyrocket or dump by a single news bulletin or movement by a whale.
Furthermore, improvements in a blockchain’s ecosystem and flaws that may come in the future cannot be taken into account at the time of prediction and their impact is then neglected. Therefore, the predictions are only of the historical data and can tell you where the price action SHOULD move regardless of WHEN it moves there.


